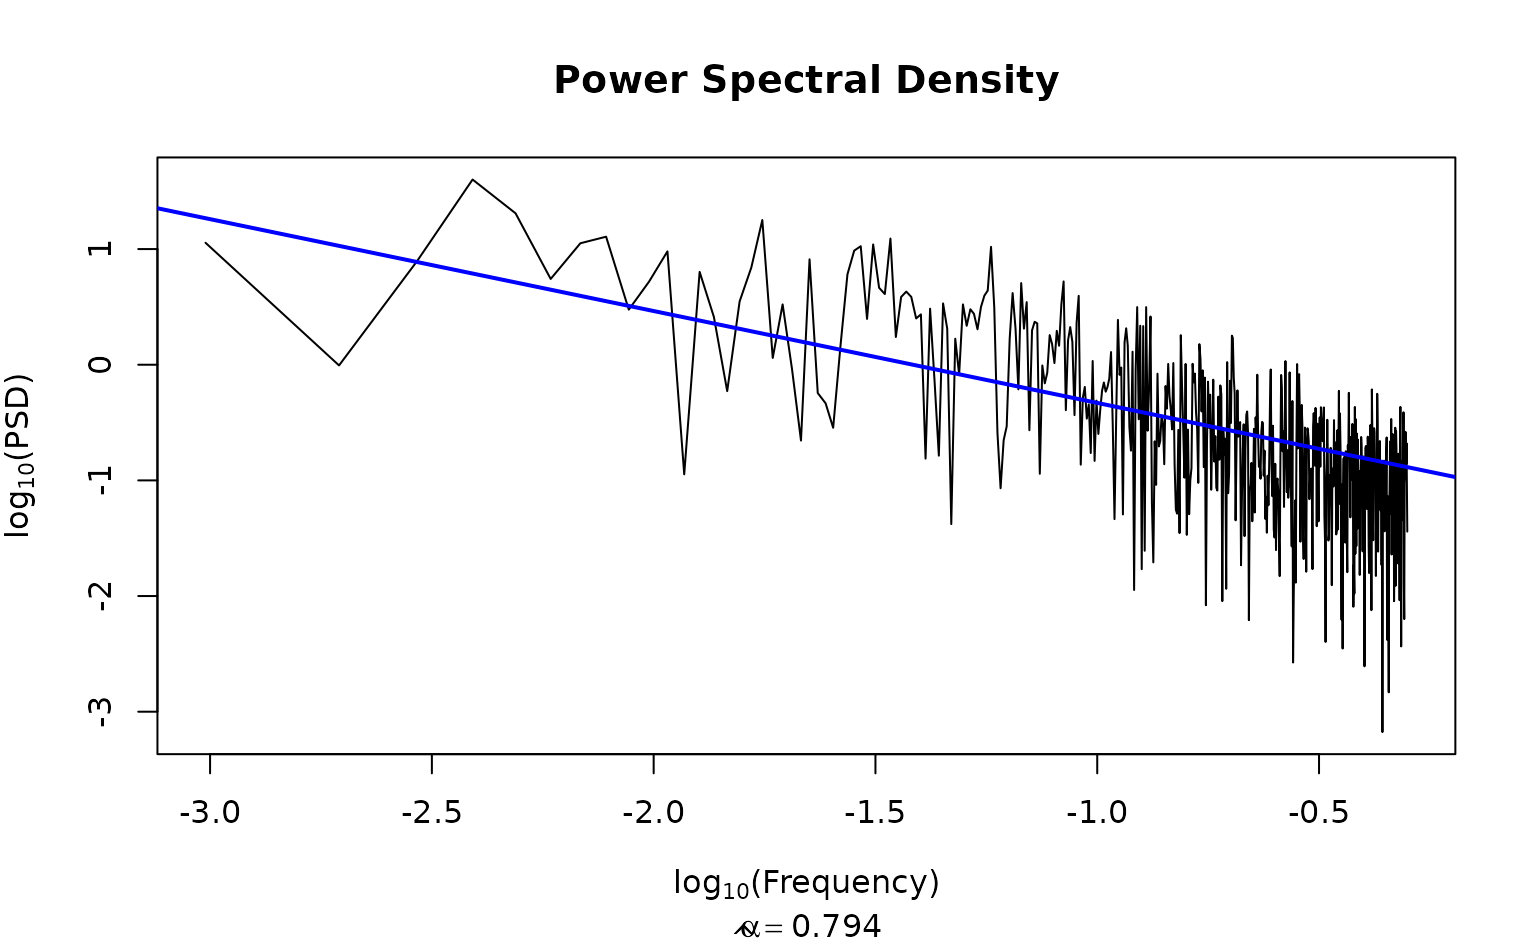
This function estimates the log power spectral density against the log frequency, and calculates a slope \(\alpha\).
calc_PSD(chain, max_freq = 0.1, filter_freq = TRUE, plot = FALSE)Arguments
- chain
Matrix of n x d dimensions, n = iterations, d = dimensions sequence
- max_freq
The maximum frequency to be considered in PSD if
filter_freq = TRUE. See alsoDetails.- filter_freq
Boolean. Whether PSD only considers the frequencies between 0 and
max_freq. The default setting isTRUE. See alsoDetails.- plot
Boolean. Whether to return a plot or the elements used to make it.
Value
Returns a list with log frequencies, log PSDs, and slope and intercept estimates.
Details
A number of studies have reported that cognitive activities contain a long-range slowly decaying autocorrelation. In the frequency domain, this is expressed as \(S(f)\) ~ \(1/f^{-\alpha}\), with \(f\) being frequency, \(S(f)\) being spectral power, and \(\alpha\) \(\epsilon\) \([0.5,1.5]\) is considered \(1/f\) scaling. See See Zhu et al. (2018) for a comparison of Levy Flight and PSD measures for different samplers in multimodal representations.
The default frequency range in PSD analysis extends from 0 to 0.1, which is specified by max_freq. It is because the logarithmic spectral power density tends to flatten beyond a frequency of 0.1. As a result, some researchers (e.g., Gilden et al. 1995
; Zhu et al. 2022
) estimate the value of \(\alpha\) using only frequencies below 0.1. When filter_freq is set to FALSE, the frequency range will be from 0 to the Nyquist frequency.
References
Gilden D, Thornton T, Mallon M (1995).
“1f Noise in Human Cognition.”
Science, 267(5205), 1837--1839.
ISSN 0036-8075, 1095-9203, doi:10.1126/science.7892611
.
Zhu J, León-Villagrá P, Chater N, Sanborn AN (2022).
“Understanding the Structure of Cognitive Noise.”
PLoS Computational Biology, 18(8), e1010312.
doi:10.1371/journal.pcbi.1010312
.
Zhu J, Sanborn AN, Chater N (2018).
“Mental Sampling in Multimodal Representations.”
Advances in Neural Information Processing Systems, 31, 5748--5759.
Examples
set.seed(1)
chain1 <- sampler_mh(1, "norm", c(0,1), diag(1))
calc_PSD(chain1[[1]], plot= TRUE)

#> $log_freq
#>   [1] -3.010300 -2.709270 -2.533179 -2.408240 -2.311330 -2.232149 -2.165202
#>   [8] -2.107210 -2.056057 -2.010300 -1.968907 -1.931119 -1.896357 -1.864172
#>  [15] -1.834209 -1.806180 -1.779851 -1.755027 -1.731546 -1.709270 -1.688081
#>  [22] -1.667877 -1.648572 -1.630089 -1.612360 -1.595327 -1.578936 -1.563142
#>  [29] -1.547902 -1.533179 -1.518938 -1.505150 -1.491786 -1.478821 -1.466232
#>  [36] -1.453997 -1.442098 -1.430516 -1.419235 -1.408240 -1.397516 -1.387051
#>  [43] -1.376832 -1.366847 -1.357087 -1.347542 -1.338202 -1.329059 -1.320104
#>  [50] -1.311330 -1.302730 -1.294297 -1.286024 -1.277906 -1.269937 -1.262112
#>  [57] -1.254425 -1.246872 -1.239448 -1.232149 -1.224970 -1.217908 -1.210959
#>  [64] -1.204120 -1.197387 -1.190756 -1.184225 -1.177791 -1.171451 -1.165202
#>  [71] -1.159042 -1.152967 -1.146977 -1.141068 -1.135239 -1.129486 -1.123809
#>  [78] -1.118205 -1.112673 -1.107210 -1.101815 -1.096486 -1.091222 -1.086021
#>  [85] -1.080881 -1.075802 -1.070781 -1.065817 -1.060910 -1.056057 -1.051259
#>  [92] -1.046512 -1.041817 -1.037172 -1.032576 -1.028029 -1.023528 -1.019074
#>  [99] -1.014665 -1.010300 -1.005979 -1.001700
#>
#> $log_psd
#>   [1]  1.054538094 -0.005930573  0.896786005  1.601153185  1.309203752
#>   [6]  0.741801273  1.050227678  1.106918969  0.476371236  0.718913806
#>  [11]  0.980239063 -0.947765261  0.802918292  0.412632319 -0.228496611
#>  [16]  0.547708384  0.840352208  1.251342067  0.058799573  0.521948989
#>  [21] -0.038402312 -0.655631219  0.911660674 -0.244662100 -0.333394109
#>  [26] -0.545201065  0.158920085  0.781421260  0.986483649  1.024663776
#>  [31]  0.396074099  1.040048502  0.665157519  0.611152390  1.091004665
#>  [36]  0.239480726  0.585810241  0.632275406  0.586461558  0.400097363
#>  [41]  0.435268345 -0.811692044  0.484834706 -0.135284380 -0.786454705
#>  [46]  0.530231443  0.310909536 -1.378052324  0.224985374 -0.085111407
#>  [51]  0.521496950  0.336236148  0.479501668  0.439830966  0.306298043
#>  [56]  0.499145188  0.597450019  0.641347778  1.019261082  0.495493648
#>  [61] -0.588163269 -1.068117959 -0.652041316 -0.533067666  0.223713776
#>  [66]  0.619575998  0.313565577 -0.212928453  0.705966068  0.311988095
#>  [71]  0.541442412 -0.566372980  0.297204838  0.371315806  0.357277088
#>  [76] -0.942967528 -0.006309224 -0.161103006 -0.069185213  0.256348277
#>  [81]  0.179048043  0.014246940  0.293014073  0.164090080  0.519949731
#>  [86]  0.720432771 -0.393030620  0.209787414  0.325830141  0.197958377
#>  [91] -0.435851122  0.362577011  0.595811630 -0.864417793 -0.288802475
#>  [96] -0.192087883 -0.465824519 -0.343159860 -0.763506884  0.032398155
#> [101] -0.831714982 -0.310152145
#>
#> $polyfit
#>      slope  intercept
#> -0.4706896 -0.4004479
#>