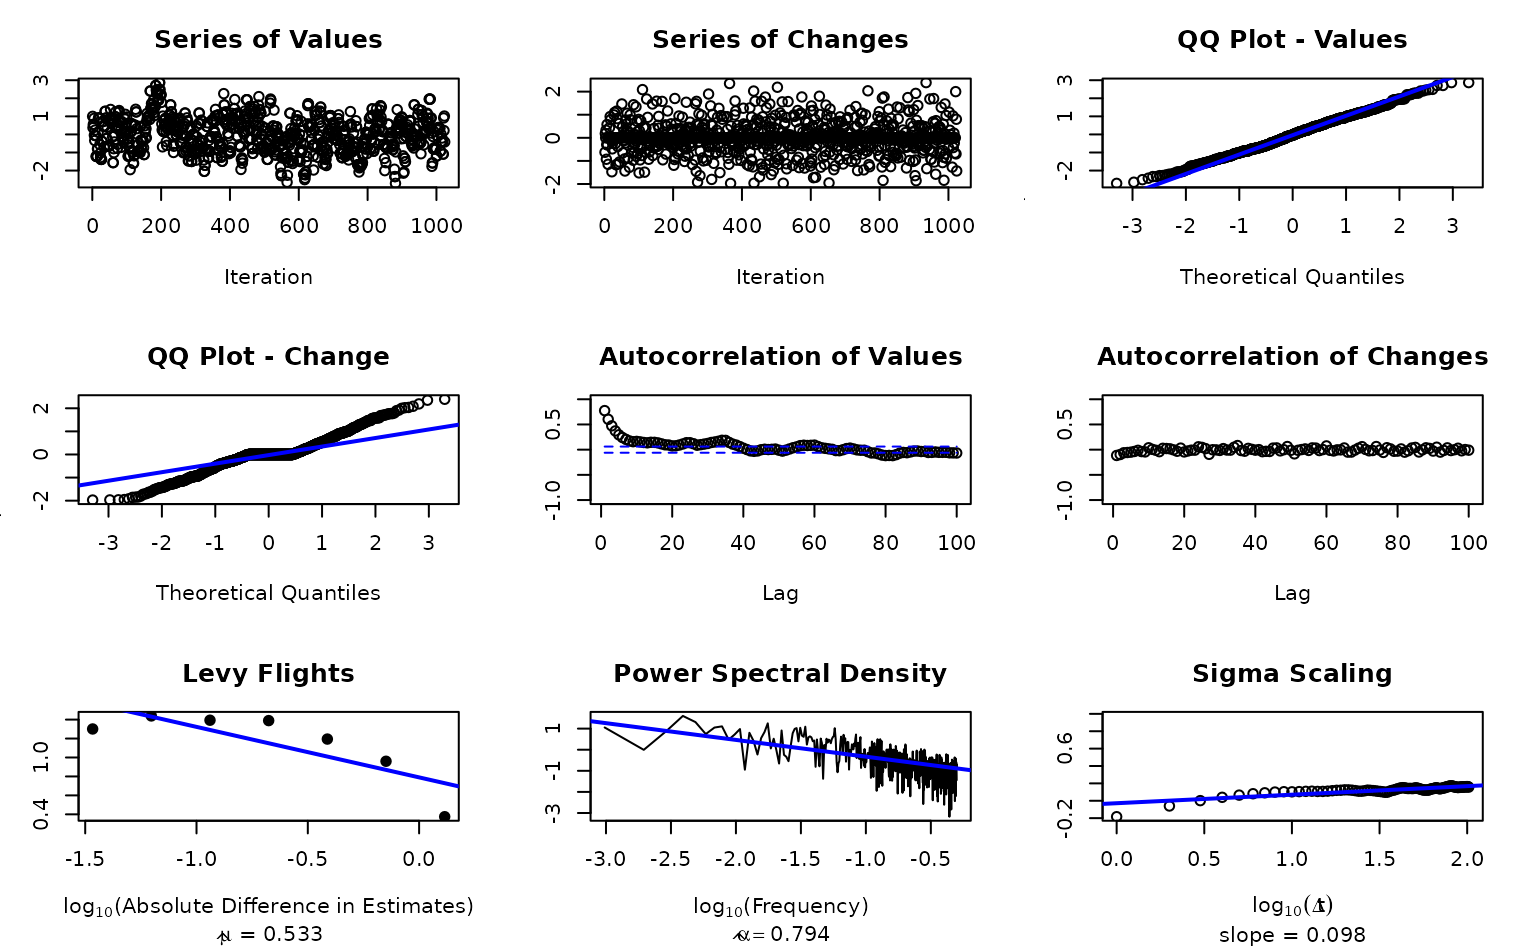
Calculates all diagnostic functions in the samplr package for a given chain. Optionally, plots them.
calc_all(
  chain,
  plot = TRUE,
  max_freq = 0.1,
  filter_freq = TRUE,
  acf.alpha = 0.05,
  acf.lag.max = 100
)
Arguments
- chain
Vector of n length, where n is the number of trials or sampler iterations
- plot
Boolean. Whether to additionally plot the diagnostics.
- max_freq, filter_freq
Additional parameters to calc_PSD.
- acf.alpha, acf.lag.max
Additional parameters to calc_autocorr.
Value
A list with all diagnostic calculations (a list of lists); and optionally a grid of plots.
Examples
set.seed(1)
chain1 <- sampler_mh(1, "norm", c(0,1), diag(1))
diagnostics <- calc_all(chain1[[1]])

names(diagnostics)
#> [1] "value_qqplot"    "change_qqplot"   "value_autocorr"  "change_autocorr"
#> [5] "levy"            "PSD"             "sigma_scaling"